On this page:
Introduction to QGIS
QGIS is one of many Geographic Information Systems (GIS) applications. It is an opensource software that is free to use and has several plugins to improve functionality.
- Launch the QGIS application by opening QGIS Desktop 3.28.xx from the Windows Start Menu.
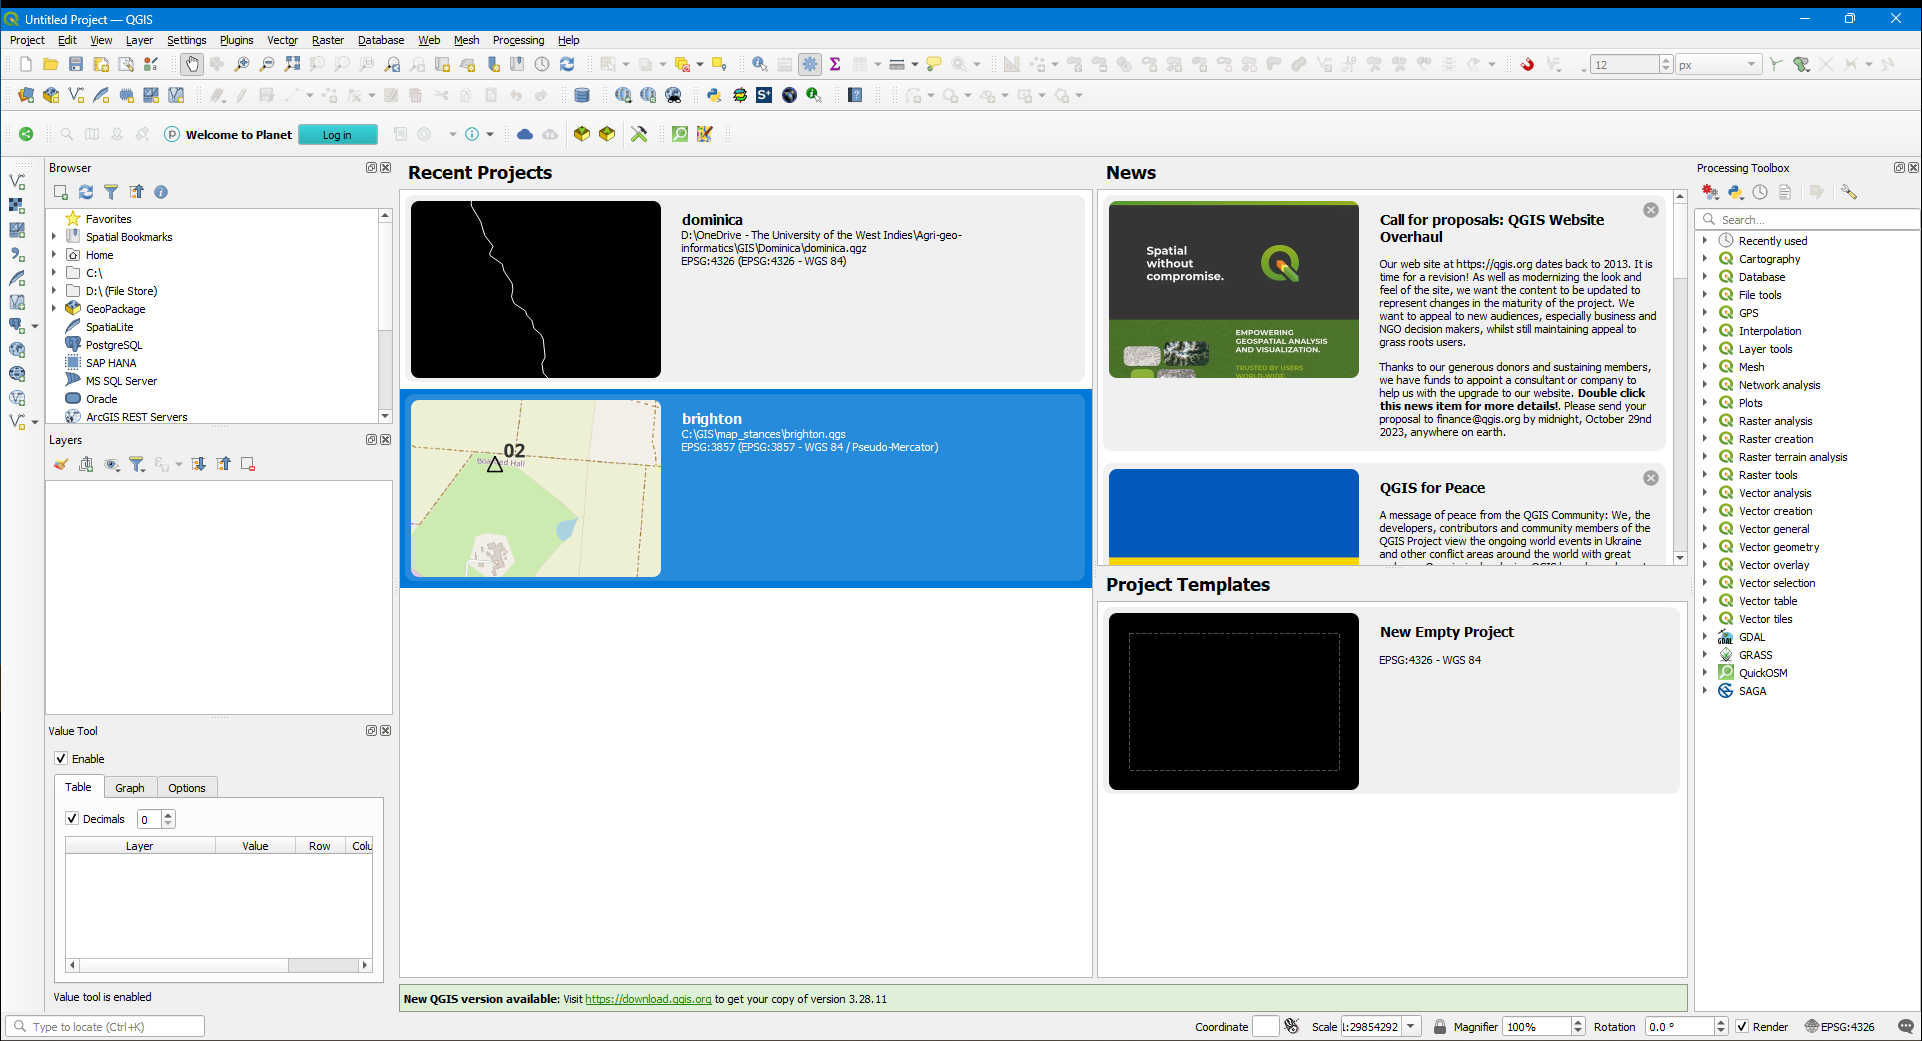
The main interface will be similar to the one below, with the menu bar, toolbars and panels. The panels and toolbars can be dragged around the interface or docked to the sides.
Panels and Toolbars
Panels and toolbars allow easy access to functions and tools. They can be activated or deactivated from the menu bar or by right-clicking any toolbar. We will add a few useful toolbars. On the menu bar, go to View --> Toolbars and select the following toolbars:
- Data Source Manager Toolbar
- Digitizing Toolbar
- Manage Layers Toolbar
- Snapping Toolbar
You can go to View --> Panels or right-click any toolbar to add these panels:
- Browser Panel
- Identify Results Panel
- Layers Panel
Creating/Saving a project
- On the menu bar, go to
Project --> Saveor use the save icon on theProject Toolbar. - Navigate to a preferred folder and create a new folder called
Dominica-training. - Save the project as
dominica.qgz.
Adding vector data
- Download the following file to the project folder:
Dominica administrative boundaries - country outline and parish boundaries.
- Drag the file into the Layers Panel.
-
Click
Add Layersin the popup window. - Alternatively, you can go to
Layer --> Add Layer --> Vector Layer. You can also use theManage Layers Toolbar. - Under source, press the overflow icon (3 dots) to browse for the vector file.
- Click
Add, clickClose.
The files will appear in the Layers Panel.
About layers
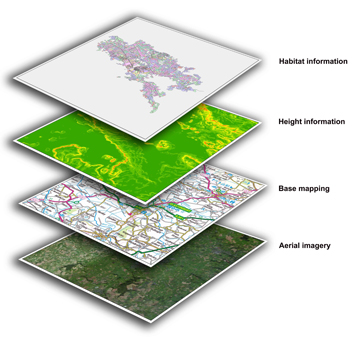
In a GIS application, data are managed in layers stacked on each other, e.g. farmlands over the admin boundaries stacked on top of a basemap. The order of the layers will influence their visibility. The layers can be reordered by dragging them up and down in the Layers Panel.
- Reorder the layers so that
parishes.shpis abovecoastline.shp.
The zip file contain several files. Notice that the Layers Panel displays the shape files (.shp) as a group.
- Expand or collapse the group by clicking the arrow on the left.
- Use the
Manage Map Themesicon (eyeball) on the Layers Panel toHide All Layers. - We will select the shapefiles. Check the boxes next to
parishes.shpandcoastline.shplayers. - If the layer is out of focus in the view pane, right-click the layer and choose
Zoom to Layer(s). - You can remove layers from the
Layers Panelby selecting them and clicking theRemove Layers/Groupicon. (Use CTRL + click to select multiple layers).
Vector file types
Vector files come in several formats including the popular Shapefile (.shp, .dbf, .shx), .geojson, Google KML (.kml, .kmz), etc.
Styling vector layers
There are several styles that can be applied to layers to enhance visibility. We will change the symbology of each layer to our preference.
- Double-click the
coastline.shplayer to launch the layer properties window. Alternatively, right-click the layer and chooseProperties. - Select the
Symbologytab. - Change the
Simple FilltoOutline: Simple Lineand change the color. - Click
Apply. When done clickOK. - Save the project.
Attribute table
The attribute table displays the data in the vector file.
- To open the attribute table, right-click the
parishes.shplayer and selectOpen Attribute Table.
Notice that each feature is identified by a unique ID which is essential for any data storage application. From here you can see information for each boundary, including the parish names.
- Click the right-most icon to dock the attribute table.
Identify features tool
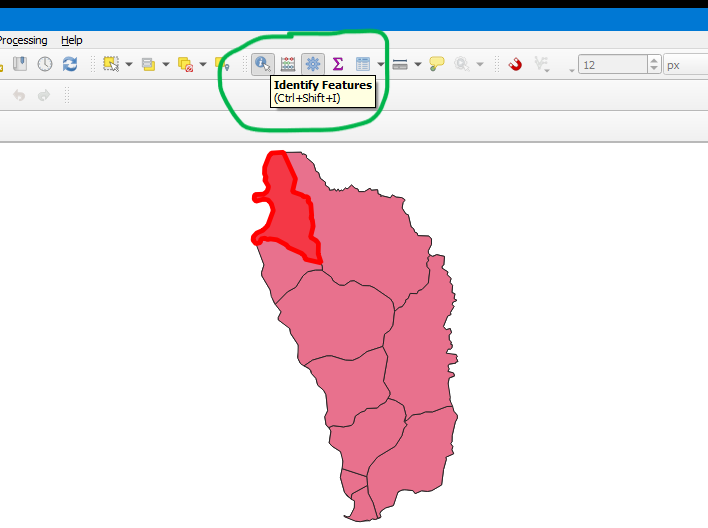
The Identify Features Tool on the Attribute Toolbar will show data in the Identify Results panel for any selected feature.
- Click the
Identify Features Toolto enable it. - Click any parish to see the data in the
Identify Resultspanel.
Adding raster data
- Download the following file to your project folder:
- Use the
Browser Panelto locate the downloaded filemoisture-index.tiff. - Drag the file from the
Browser Panelto theLayers Panel. Alternatively, you can go toLayer --> Add Layer --> Raster Layer. You can also use theManage Layers Toolbar. - Arrange the layers so that
moisture-indexis at the bottom. - Save the project.
Raster file types
The most common file type used for raster data is the GeoTIFF (.TIFF). This is the general format for satellite imagery.
Styling raster layers
Notice that raster layer is made up of 3 bands: red, green and blue. Rasters can be composed of 1 or more bands containing different data. These bands can be styled to produce the required visualization.
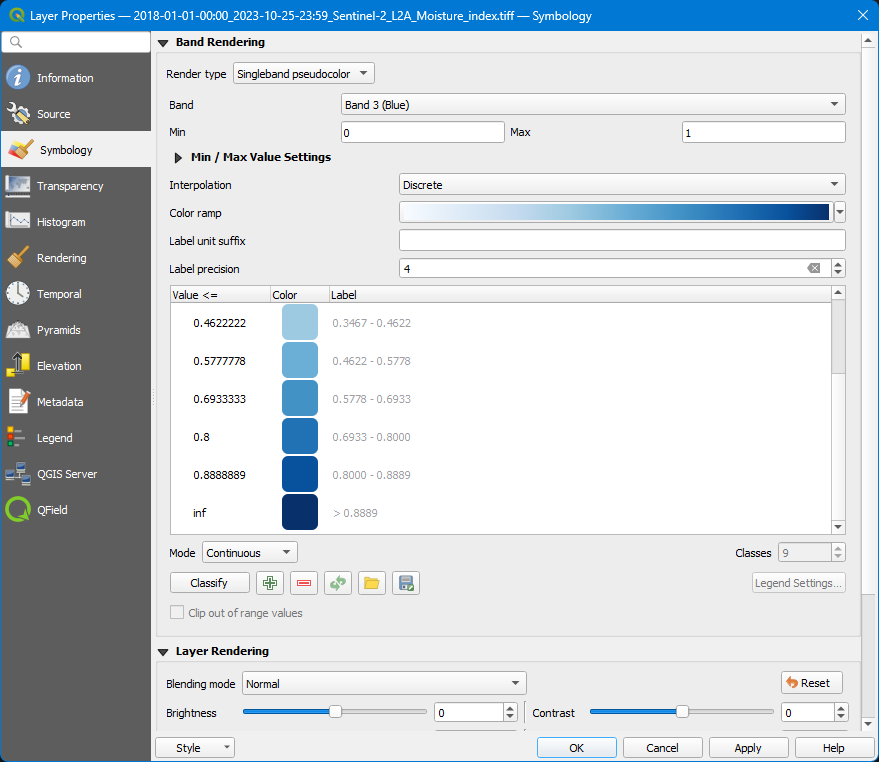
- Double-click the layer to open its properties and switch to the
Symbologytab. - Notice the
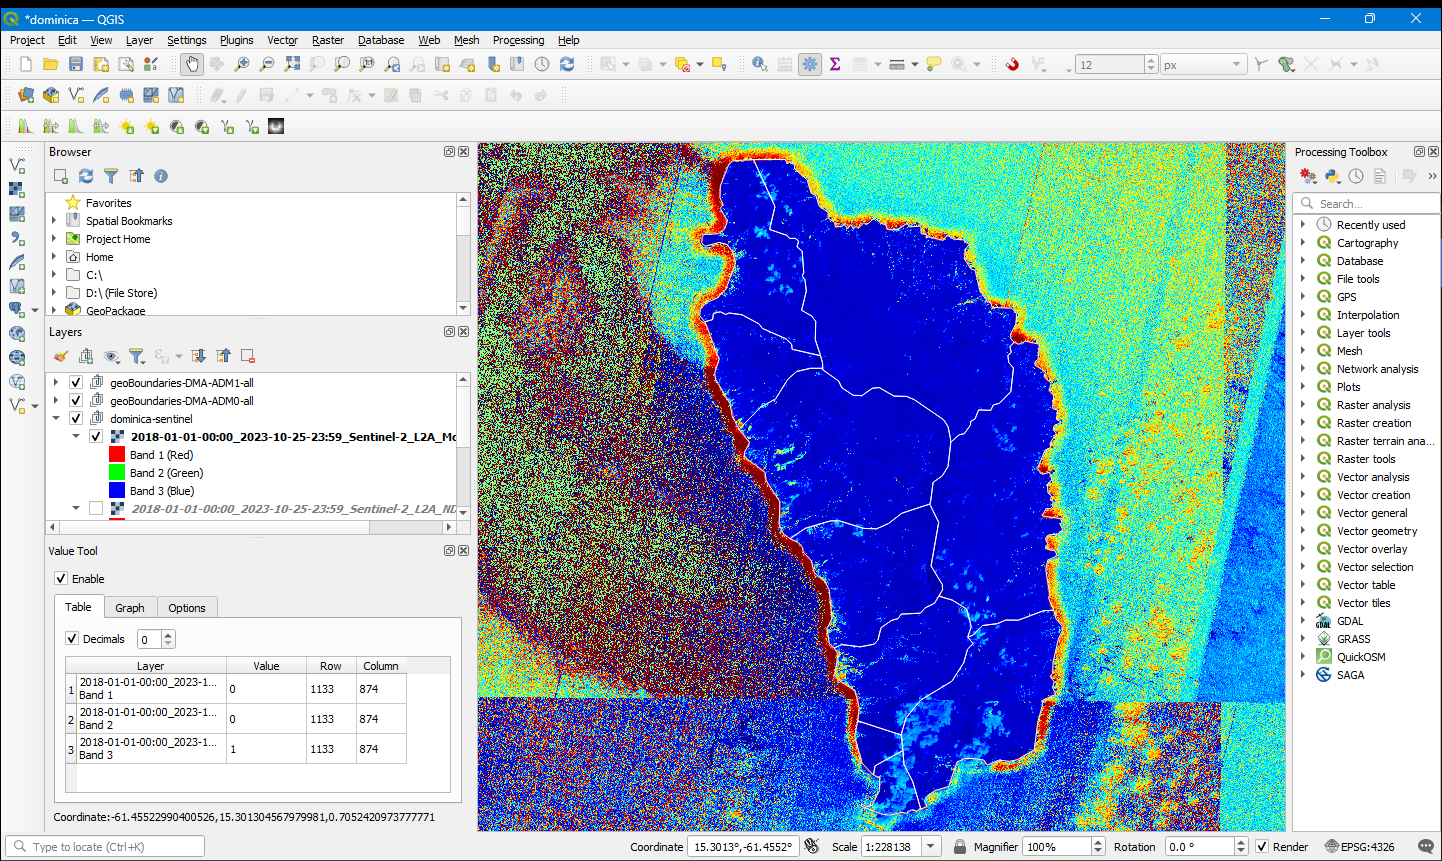
Render typeis set toMultiband colordisplaying the red, green and blue bands in order. Change theRender typetoSingleband pseudocolor. - At
Band, selectBand 3 (Blue). - At
Interpolation, selectDiscrete. - Use a blue
Color ramp. - Click
ApplyandOKwhen finished. - Select the
moisture-indexlayer. - Use the
Identify Featurestool to click on the map and view the results in theIdentify Resultspanel.
Area of interest
The extent of the raster is larger than the island. We do not need the ocean area in the image so we’ll clip it to coasts of Dominica. For this process we’ll use the raster image and clip it using the coastline.shp file.
- From the menu bar, select
Raster --> Extraction --> Clip Raster by Mask Layer. - Select the
moisture-indexas theInput Layer. - Select the
coastline.shpfile as theMask Layer. - Set the nodata value to 0.
- Select
Match the extent of the clipped raster...andKeep resolution of the input raster. - By default, the output is saved to a temporary file. Saved the clipped mask as
dominica-moisture-index.tifto your project folder. - Click
Runto generate the output raster, thenClose.
Copying styles
You will notice that the new raster has lost the pseudocolor styling from the original and has defaulted to the multiband color. To fix this, copy the style from the original layer.
- Right-click the
moisture-indexlayer and selectStyles --> Copy Style. - Right-click the clipped raster layer and select
Styles --> Paste Style. - Be sure the disable the original layer.
- Re-order the layers to show the details you want.
- Save your project.
Adding labels
Labels can be added using the content of the vector layer’s attribute table. We will add the parish names which were listed under NAME_1 in the attribute table.
- Double-click the
parishes.shpvector layer to open its properties. - Go to the
Labelstab. - Select
Single Labelsfrom the dropdown. - For
Value, selectNAME_1. - Click
Apply.
The labels can be styled using the various options available such as Text, Formatting, Placement, etc.
- Click
Apply to see the changesandOKwhen done. - In the main window, the labels can be activated by right-clicking the layer and selecting
Show labels.
Next, we will create a map layout for printing.