Creating maps with QGIS
QGIS can be used to create printable maps with borders, scales, etc.
- From the menu bar, go to
Project --> New Print Layout. - Enter a name for the layout, e.g.
dominica_moisture_indexand clickOK. A new window will open. - In the new window, go to the menu bar and click
Add Item --> Add Map. Draw a rectangle on the canvas to show the map. If you are not seeing the details you want, return to the main window and adjust the layers to display the required map details. Return to the layout window. - To add a border, go to the
Item Propertiestab on the right and checkFrame. Style the frame as desired. - To add a title or any text, on the menu bar click
Add Item --> Add Label. Draw the label text box. With the text box selected, go toItem Properties --> Main Propertiesand type the desired text. The text can be styled underAppearance. - Add a scale bar.
- Add a north arrow.
- Add a legend to the map and style it as desired (edit, delete, spacing, etc.). Hint: the
Auto updateofItem Properties --> Lengend Itemsallows changes in the main window to be reflected on the map. Uncheck this if you are changing the legend entries yourself. SelectOnly show items inside linked map. - Save your map layout by clicking
Layout --> Save Projecton the menu bar. - Export the map:
Layout --> Export as ImageorExport as PDF. - Close the map window when finished.
- You can reopen the layout from the main window menu bar:
Project --> Layoutsor useProject --> Layout Manager.
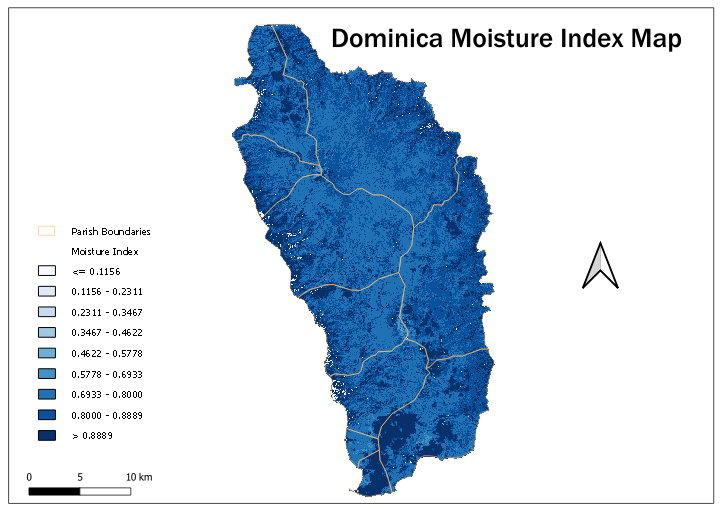
Sample map developed with QGIS.